Conditional Aggregates for Data Quality Metrics
Segment-level metrics reveal data quality problems hidden by table-wide averages.
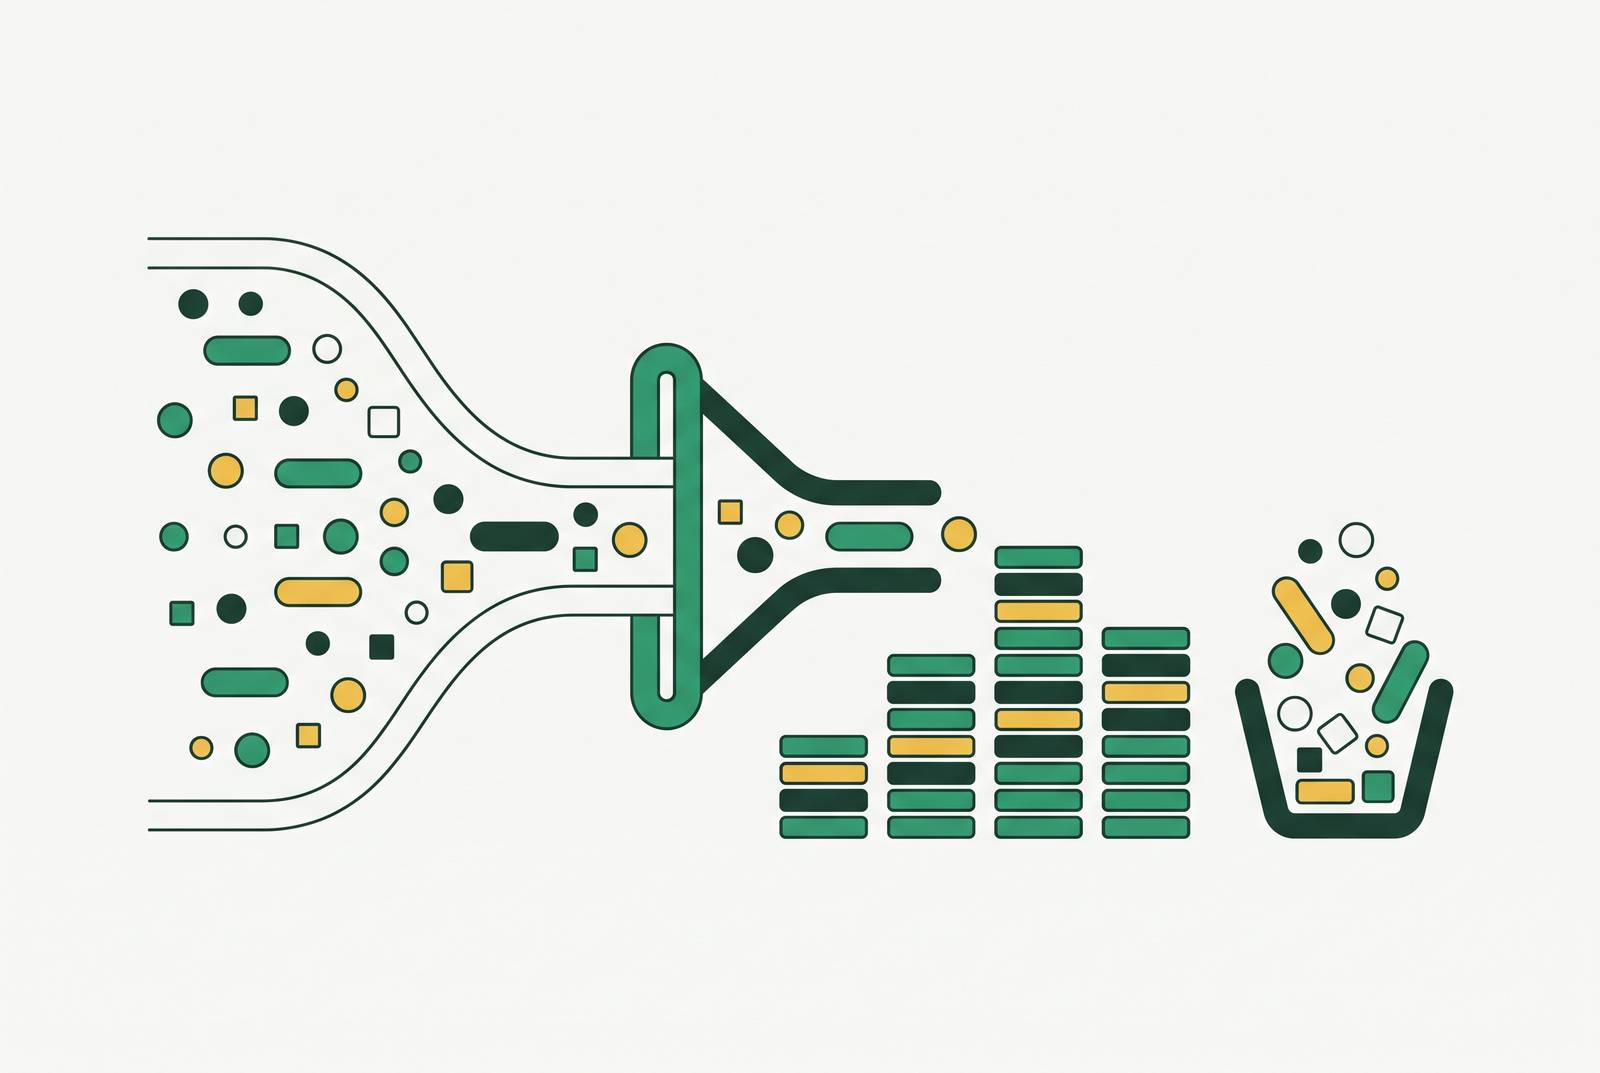
A CRM table can report high consistency where a value is uniform across systems or fields that should agree, yet still be useless for routing leads, because the one field that matters for routing might be null on nearly every record from a single source while every other source fills it in reliably. That is the central failure this article addresses: a single table-wide number can look healthy while hiding damage that is concentrated in one subpopulation. Bylois, Neven and Vansummeren, writing in Information Systems Frontiers, describe this as two separate failures stacked on top of each other: global metrics only give a coarse-grained read on the data, and even when they do flag a problem, they cannot say which records caused it. The structure of a standard data quality check explains why. A rule defines a condition to test, a check evaluates that condition against each record, and a metric aggregates the results across some population. When that population is the entire table, the aggregation itself is what buries the broken subset, averaging a handful of badly damaged records into a sea of healthy ones until the damage disappears from view. Global metrics are easier to build and easier to put in front of a stakeholder as a single number, but that simplicity comes at the cost of knowing where to look when something fails. A metric that clears its threshold tells a team nothing about which segment, which source, or which field needs attention.
Conditional aggregation and the NULL-exclusion mechanism
Conditional aggregation gets around this by using a behavior that is already built into SQL rather than bolting on new logic. It combines aggregate functions like SUM and COUNT with CASE expressions to compute several targeted summaries in a single pass over a table, with no joins and no separate queries run side by side. The mechanism is simple enough to hold in your head: a CASE WHEN expression returns a value when its condition is true and returns NULL when it isn't, and because SQL's aggregate functions automatically skip NULLs, only the rows that satisfy the condition actually enter the calculation. Nothing about this is a workaround bolted onto the language. It's how SQL aggregation has always worked. No special handling, no extra filtering step, and no separate pass is needed to get a conditional count.
A basic completeness check shows the pattern in its simplest form:
SELECT
 SUM(CASE WHEN email IS NOT NULL THEN 1 ELSE 0 END) / COUNT(*) * 100 AS completeness_pct
FROM crm_contacts;
Ayeni, writing in 2026, lays out three related ways to apply conditional logic in a query: filtering before aggregation with a WHERE clause, which removes irrelevant rows before any grouping starts; filtering after aggregation with a HAVING clause, which keeps only the groups that clear a threshold; and conditionally including values inside an aggregate function using CASE WHEN, which computes several targeted metrics within a single query. The third pattern is the one that makes multi-dimensional data quality measurement possible, because it lets one query compute completeness, validity, and consistency side by side rather than one metric per pass. A WHERE clause removes rows before any grouping or aggregation happens, which makes it reliable for excluding rows wholesale. A CASE WHEN inside an aggregate function, by contrast, runs its logic within each group, which is exactly the tool needed when the goal is several conditional counts out of the same group rather than a single filtered row set. Because the whole thing runs in one scan over one table, a team gets completeness, validity, consistency, and uniqueness back from a single query instead of running one query per dimension and stitching the results together afterward.
Mapping conditional aggregation to the standard data quality dimensions
Each of the standard data quality dimensions, which most practitioners already think in terms of, turns out to be expressible as a conditional aggregate with nothing more than a change in the condition inside the CASE WHEN. The dimensions aren't abstract categories that require a separate tool to measure, they're a change of condition away from being a query.
| Dimension | What it measures | Conditional-aggregate expression | |---|---|---| | Completeness | Share of non-null values in a required field | SUM(CASE WHEN field IS NOT NULL THEN 1 ELSE 0 END) / COUNT(*) | | Validity | Share of records whose value falls inside an accepted set, catching out-of-range values, malformed formats, and enum violations | SUM(CASE WHEN status IN ('active','churned','prospect') THEN 1 ELSE 0 END) / COUNT(*) | | Consistency | Share of records where a value agrees across systems or fields that are supposed to match, surfacing cross-system mismatches that break attribution and reporting | SUM(CASE WHEN crm_stage = ops_stage THEN 1 ELSE 0 END) / COUNT(*) | | Uniqueness | Duplicate record rate | (COUNT(*) - COUNT(DISTINCT key)) / COUNT(*) |
Every one of those ten maps to the same CASE WHEN pattern with a different condition, and lakeFS, in guidance updated in February 2026, draws a distinction worth keeping in mind here: a dimension is a conceptual grouping, a metric is a measurement, a KPI is an evaluative signal tied to organizational goals, and conditional aggregates are the measurement layer that sits between dimension and KPI. Conditional aggregates sit in the middle of that chain. They are the measurement layer that turns a dimension like "completeness" into a number, and that number is what eventually feeds a KPI a RevOps or data engineering team actually tracks.
Running the same metric across segments to find where problems live
Adding a GROUP BY clause to a conditional aggregate query changes what the query does at a structural level. Instead of computing one number for the whole table, it computes the same metric across every segment that matters, region, lead source, account owner, product line, in the same single pass, exposing exactly the variation that a plain aggregate buries. The research brief describes this as segment analysis: one quality metric run across potentially thousands of segments at once, stores, regions, products, customer cohorts, with per-segment anomalies appearing in each segment's own results rather than vanishing into an average.
Consider a CRM contacts table, where lead source is one of the practical grouping dimensions representing a natural accountability boundary where errors tend to cluster. It hid the one source responsible for most of the bad data, and no amount of staring at the table-wide figure would have revealed it. Bylois, Neven and Vansummeren report "significant improvements over global metrics and promising results in fine-grained error detection" when conditional metrics replace global ones, and that improvement comes directly from this kind of segment-level breakdown rather than from any change in the underlying data.
For CRM and RevOps data specifically, a handful of grouping dimensions tend to do most of the work: lead source, sales region, account owner, lifecycle stage, data ingestion batch, and integration partner each mark a natural boundary where errors cluster, usually because each one corresponds to a different team, tool, or process feeding the data in. A single query can even stack several of these dimensions at once, using ROLLUP or by grouping on multiple columns together, producing a hierarchy of quality scores that runs from the whole table down to an individual segment. The resulting output can run long, a few hundred rows if the segmentation is granular enough, but the value was never in reading every row by eye. It's in filtering programmatically to the rows where a metric breaches its threshold, which hands a team the exact segment and dimension responsible for a failure, the precise information a global metric was never built to provide.
Building a multi-dimensional quality scorecard in a single query
Each column in the SELECT list is its own conditional aggregate, one for completeness, one for validity, one for consistency, one for uniqueness, all computed against the same rows in the same pass, broken out by segment.
SELECT
 lead_source,
 SUM(CASE WHEN email IS NOT NULL THEN 1 ELSE 0 END) / COUNT(*) * 100 AS completeness_pct,
 SUM(CASE WHEN status IN ('active','churned','prospect') THEN 1 ELSE 0 END) / COUNT(*) * 100 AS validity_pct,
 SUM(CASE WHEN crm_stage = ops_stage THEN 1 ELSE 0 END) / COUNT(*) * 100 AS consistency_pct,
 (COUNT(*) - COUNT(DISTINCT contact_id)) / COUNT(*) * 100 AS duplicate_pct
FROM crm_contacts
GROUP BY lead_source
HAVING SUM(CASE WHEN email IS NOT NULL THEN 1 ELSE 0 END) / COUNT(*) * 100 < 90;
This single query covers six of the eight core DataOps KPIs identified for data engineering teams: pipeline completeness rate, data freshness SLA adherence, schema validation pass rate, duplicate record rate, data accuracy rate, and cross-system consistency can all be computed as conditional aggregates directly, leaving only mean time to detect and mean time to resolve as operational measures outside the query itself. For CRM and RevOps teams, standard benchmarks translate straight into the HAVING clause or a downstream filter: a duplicate rate held below a low threshold, an email bounce rate held below a low threshold, field completion held above a high threshold for each critical field, and a monthly data decay rate held below a low threshold all become conditions that flag a breach the moment they're crossed. The output lands as a row per segment and a column per dimension, a shape that a monitoring system, an alerting rule, or an AI agent evaluating trust at decision time can read directly without any further processing. DQLabs' 2026 practitioner guide points out that the platforms worth evaluating now fold observability and quality signals into a single trust layer and keep an audit trail of every autonomous decision made against that layer. A conditional-aggregate scorecard like the one above is the SQL-native layer that feeds exactly that kind of system, built from ordinary aggregate functions rather than a separate quality product.
Why monitoring this scorecard continuously
A scorecard like the one above, run a single time, is a snapshot of conditions at that moment and nothing more. Run on every pipeline materialization, it becomes an early-warning system that catches degradation before it reaches a dashboard, a forecasting model, or an automated workflow downstream. The reason this distinction matters comes down to how CRM data actually behaves over time: B2B contact data decays at roughly a quarter of records per year, so a CRM that passes a quality check cleanly in one quarter is measurably worse by the next, even if nothing about the check itself changed. A one-time audit has no way to track that drift. A query scheduled to run continuously does, because each run captures the current state rather than relying on a snapshot from months earlier.
The cost of catching this late compounds rather than staying flat. Detection and resolution carried out after the fact cost far more than prevention would have, and teams that reach the remediation stage end up spending most of their time just finding the inconsistencies rather than fixing anything or doing productive work. Periodic batch cleaning runs into a structural limit here: a cleaning pass improves the data for a moment, but the processes generating the errors, manual entry, integration mismatches, format drift between systems, keep running uninterrupted, so the data starts decaying again the moment the cleaning finishes. Scheduling the scorecard query to run on every pipeline materialization, rather than weekly or monthly, pushes mean time to detect from days down to minutes, because the gap between when an error enters the data and when the query would catch it shrinks to the length of a single pipeline run.
Moving from a metric that alerts to one that triggers a fix
Flagging a breach and fixing it are two different jobs, and a scorecard that alerts a person and then waits is a monitoring tool, not yet a reliability system. It becomes a reliability system only once its output feeds something, a script, an agent, a workflow, that proposes or applies the fix on its own. When a conditional-aggregate check shows a segment's completeness has dropped below threshold, the useful response is a targeted enrichment, a deduplication pass, or a field standardization applied specifically to the records that failed the condition, not a ticket added to a backlog, with nothing broader and nothing left for someone to triage later.
The Anrok case shows what this looks like in practice at the RevOps level: consolidating tools and replacing periodic batch cleaning with continuous CRM enrichment and signal-triggered deduplication, rather than leaving a human to work through a backlog, cut SDR workflow time sharply and generated substantial pipeline within a few months. The underlying accountability problem in most RevOps organizations is structural rather than a matter of individual effort: when data quality is treated as someone else's responsibility across sales, marketing, and RevOps, dirty records pile up because no single team owns the fix. An agent that watches the conditional-aggregate scorecard and acts the moment a threshold breaches closes that gap directly, without requiring a reorganization or a new owner to be named. The scorecard supplies the detection. Whether a person reads an alert or a system acts on one decides whether the measurement ever turns into a result.