Distribution Shift Detection Between Pipeline Runs
Detecting when data silently changes between pipeline runs.
Unity Technologies disclosed that corrupted ingestion data cost it roughly $110 million in lost revenue from underperforming advertising models, and the failure stayed invisible until business outcomes had already deteriorated. No training set was involved in that failure, and no model had drifted away from some original baseline in the way the drift literature usually describes. Data flowing between consecutive pipeline runs had changed shape, quietly, while every job status reported success. That gap, between a pipeline that looks healthy and a pipeline that is actually producing good data, is the subject of this piece.
Most writing on distribution shift frames the problem as training data versus production data: covariate shift, concept drift, and label drift all describe some change in the relationship between inputs and outputs as a model moves from its training environment into the world. Inter-run shift is a narrower and, in some ways, a more mechanical problem. It is a change in the statistical properties of a dataset from one pipeline execution to the next, a column's mean moving, a categorical distribution skewing, a null rate climbing, with no retraining event anywhere nearby to explain it. The shift often happens before any model sees the data at all, so you can't quite apply the usual drift vocabulary here.
Pipeline monitoring treats distribution as one of five dimensions worth watching on every run, alongside freshness, volume, schema, and lineage, precisely because value distributions can shift silently even while a job shows green. Three categories of inter-run shift recur across production pipelines: schema integrity failures, where column types, names, or structures change upstream without notice; sudden mean or variance shifts that point to a problem in how data is being generated further up the chain; and gradual decay of business data that accumulates, run after run, until the cumulative change becomes impossible to ignore. Each of these can pass every existing check a pipeline runs and still corrupt everything downstream of it.
What causes distribution to shift between consecutive runs
Inter-run distribution shift traces back to three distinguishable root causes, and identifying which one is active determines which detection signal applies and which fix actually resolves it. Treating all three as the same problem is how teams end up either over-monitoring stable systems or under-monitoring the ones quietly rotting.
The first cause sits upstream of the pipeline entirely: system upgrades or platform mergers that map data fields incorrectly. If a migration renames a column, changes its type, or silently drops a transformation step, you get a pipeline that completes without error while it delivers the wrong values to everything downstream. Schema drift of this kind ranks among the most common causes of silent pipeline breakage, because success and correctness are not the same signal, and most pipelines only check for the first one.
The second cause lives in how source systems generate data. A sudden shift in a column's mean or variance frequently signals a change in how an upstream system is recording values rather than a failure in a downstream model. Practitioners are warned that when PSI alerts fire on engineered features, the right first move is auditing upstream pipelines before touching the model at all, because a large share of apparent "drift" events turn out to be bugs introduced in feature code rather than genuine shifts in the underlying population. A column that suddenly reports more nulls, or a timestamp field that starts arriving in a different format, points at the generator, not at the consumer.
The third cause has no single trigger. Business data decays steadily, as people change jobs, companies relocate, and contact details go stale, and across enough pipeline runs that decay accumulates into a measurable distribution shift in CRM and RevOps systems even without any one event setting it off. This is the quietest of the three causes and the easiest to miss, because no single run looks abnormal.
Detection only becomes useful once lineage is part of the picture. A PSI alert on a feature column means little until you know whether the source schema changed, the upstream generator changed, or the real-world population genuinely shifted, and detection without that context produces noise rather than signal.
The statistical signals that reliably detect inter-run shift
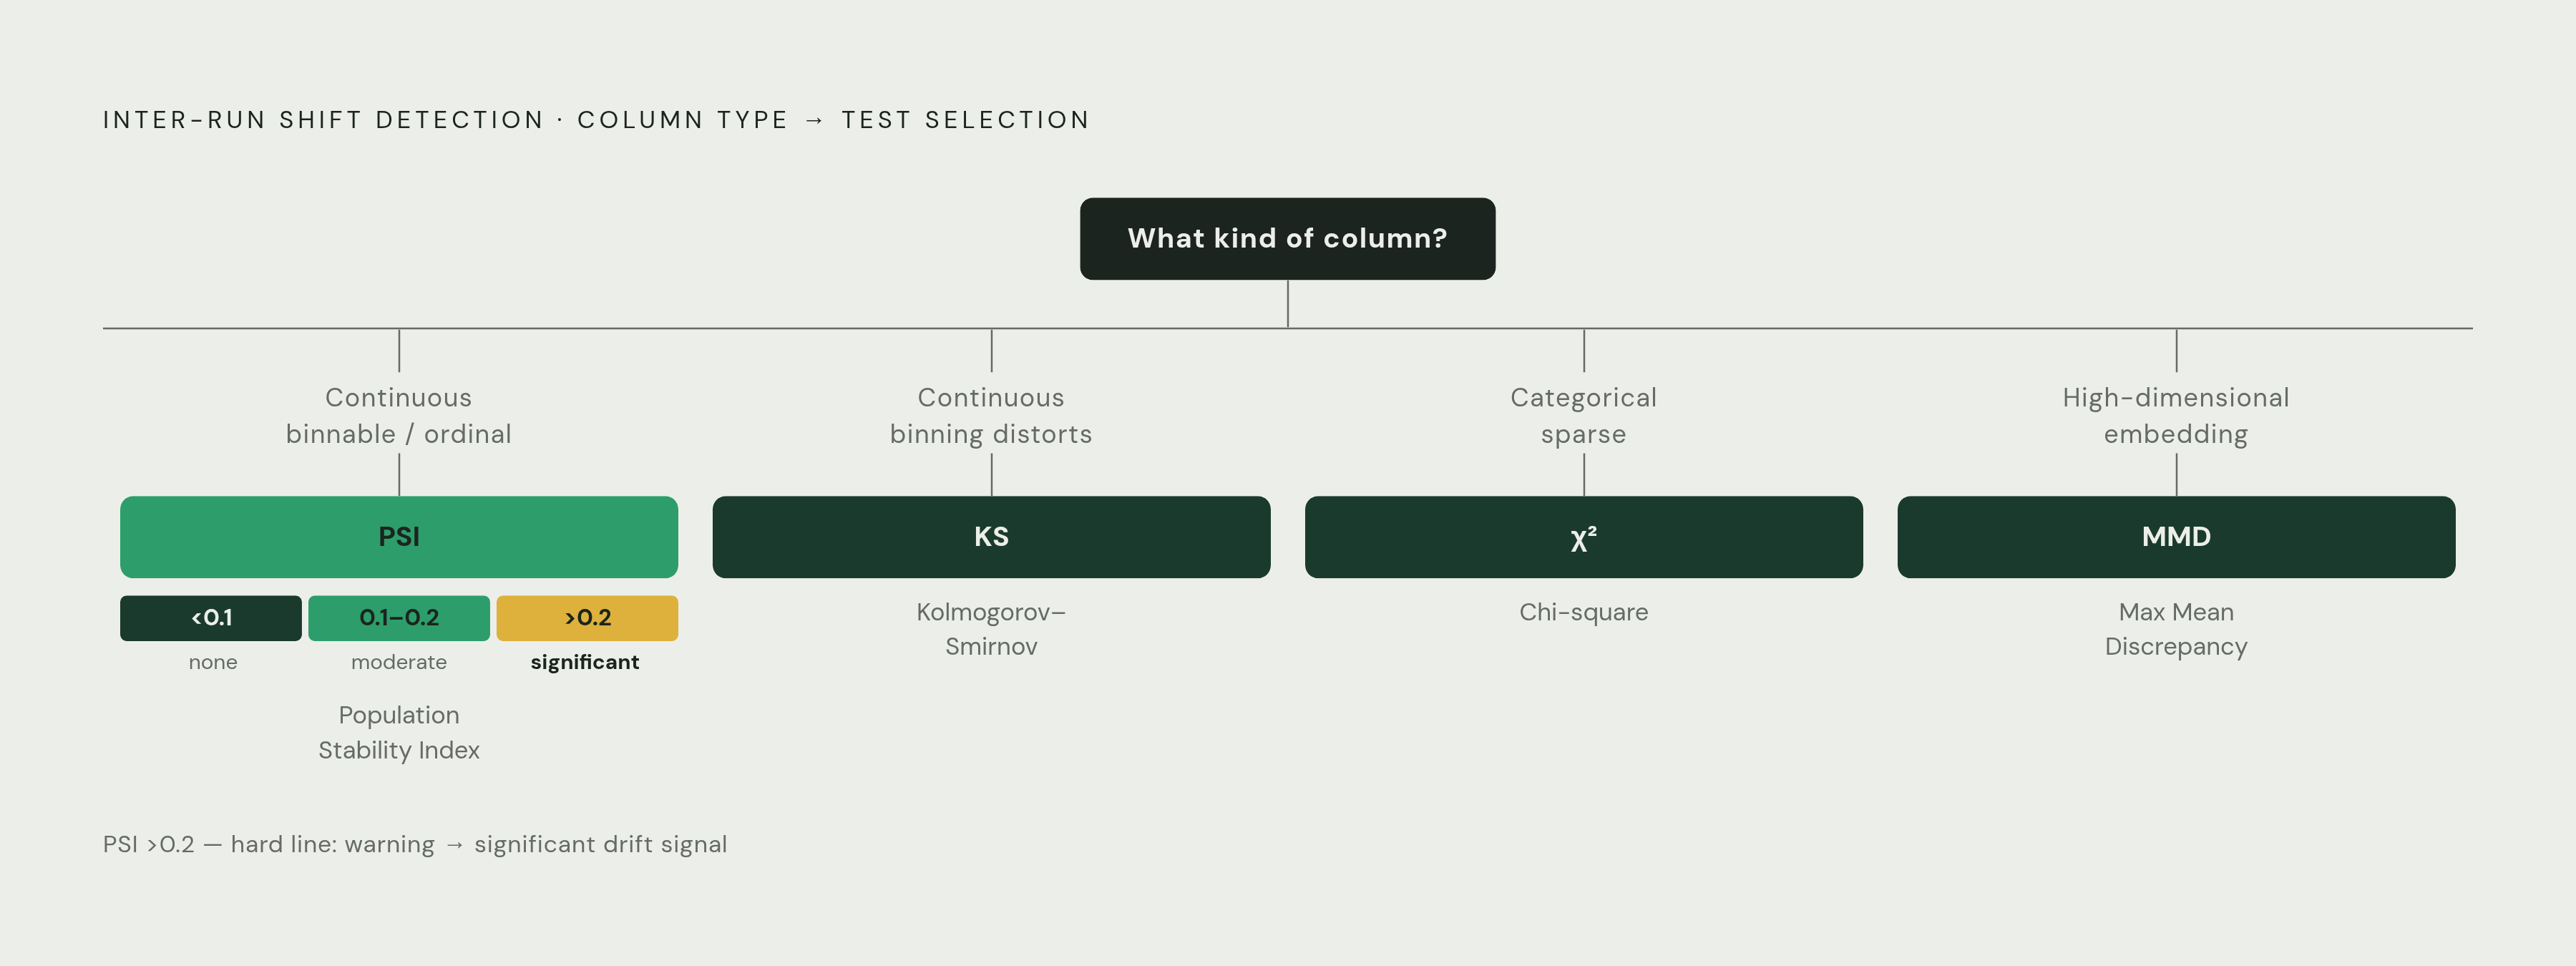
Four statistical tests cover most inter-run shift detection needs, and each one has a defined scope: used on the wrong data type, a test either misses real shift or buries a team in false alerts. Choosing among them starts with a simple question: what kind of column is this, and what does the pipeline have to compare it against?
For binnable continuous and ordinal features, the Population Stability Index is the standard tool. PSI buckets a reference distribution and a production distribution, then it sums, across bins, the quantity (actual minus expected) times the natural log of actual over expected. The output comes with fixed interpretation bands: a PSI under 0.1 means no significant shift, a score between 0.1 and 0.2 means moderate shift worth a look, and anything above 0.2 means significant drift on that feature.
For continuous features where binning feels like a distortion, the Kolmogorov-Smirnov test compares cumulative distributions directly, using the two-sample KS statistic with a p-value threshold calibrated against expected batch size so that larger batches don't trip the alert on noise alone. If a categorical feature is sparse, PSI's binning assumptions start to break down, so you're better off with a chi-square test comparing observed against expected counts across buckets. And for high-dimensional or embedding-typed columns, where neither binning nor a simple cumulative comparison makes sense, cosine drift on centroids or Maximum Mean Discrepancy, a non-parametric two-sample test that works directly on embeddings without binning, fills the gap.
The single most consequential decision in running any of these tests is not which formula to use but what to compare against. A common and costly mistake is this: you compare today's production data to yesterday's production data instead of to a fixed original baseline. That comparison will report "no shift" day after day even as the distribution as a whole walks steadily away from where the pipeline started, because each day's delta looks small relative to the day before it, even while the cumulative drift becomes severe. The fix is to always compare against a fixed reference baseline, never a rolling window, precisely because a rolling window is mathematically built to hide the kind of gradual decay described in the previous section.
How lineage context separates a real shift signal from noise
A PSI score above 0.2 does not answer a question. It asks one, and lineage context is the only mechanism available to answer it. Without knowing what changed upstream, a significant PSI result could mean a genuine distribution change in source data, a schema remapping that altered how values were encoded, a bug introduced somewhere in a feature engineering step, or a sampling artifact from a partial load.
That ambiguity is why the recommended first move when PSI alerts fire on engineered features is to audit upstream pipelines before acting on the alert itself. A large share of what looks like drift turns out to be a bug in feature code rather than a real shift in the underlying population, and treating a bug as a genuine distribution change leads to unnecessary retraining, which burns time and compute on a problem that a one-line code fix would have resolved.
Google Flu Trends offers an instructive case from outside the pipeline world, and it makes the same point. Lazer and Kennedy's analysis identifies two primary failure modes: "big data hubris" and "algorithmic dynamics," namely that Google's own search algorithm changed 86 times in June–July 2012 alone, which was never accounted for in the model. A shift in search term frequency looked, from the outside, like a shift in flu prevalence. Without knowing that the search algorithm itself had changed, the drift was uninterpretable, exactly the situation a PSI alert produces without lineage attached to it.
Lineage-aware monitoring closes that gap by connecting a drift signal on a downstream feature column back to the specific upstream table, ingestion job, or transformation step where the change actually originated, turning a manual, slow triage process into something closer to a direct lookup. Enterprise tooling has started to reflect this trend: platforms built to compete through 2026 increasingly operate on a full graph spanning pipeline, data, lineage, usage, and business context, rather than on isolated job logs, and end-to-end lineage coverage has become a standard criterion in how enterprise buyers evaluate these tools. Related to lineage is alert clustering: a single upstream schema change can fan out into dozens of downstream drift alerts, and collapsing those into one incident with a propagation timeline is what separates a five-minute root-cause exercise from an afternoon of manual correlation.
Runtime checks that catch shift before it propagates downstream
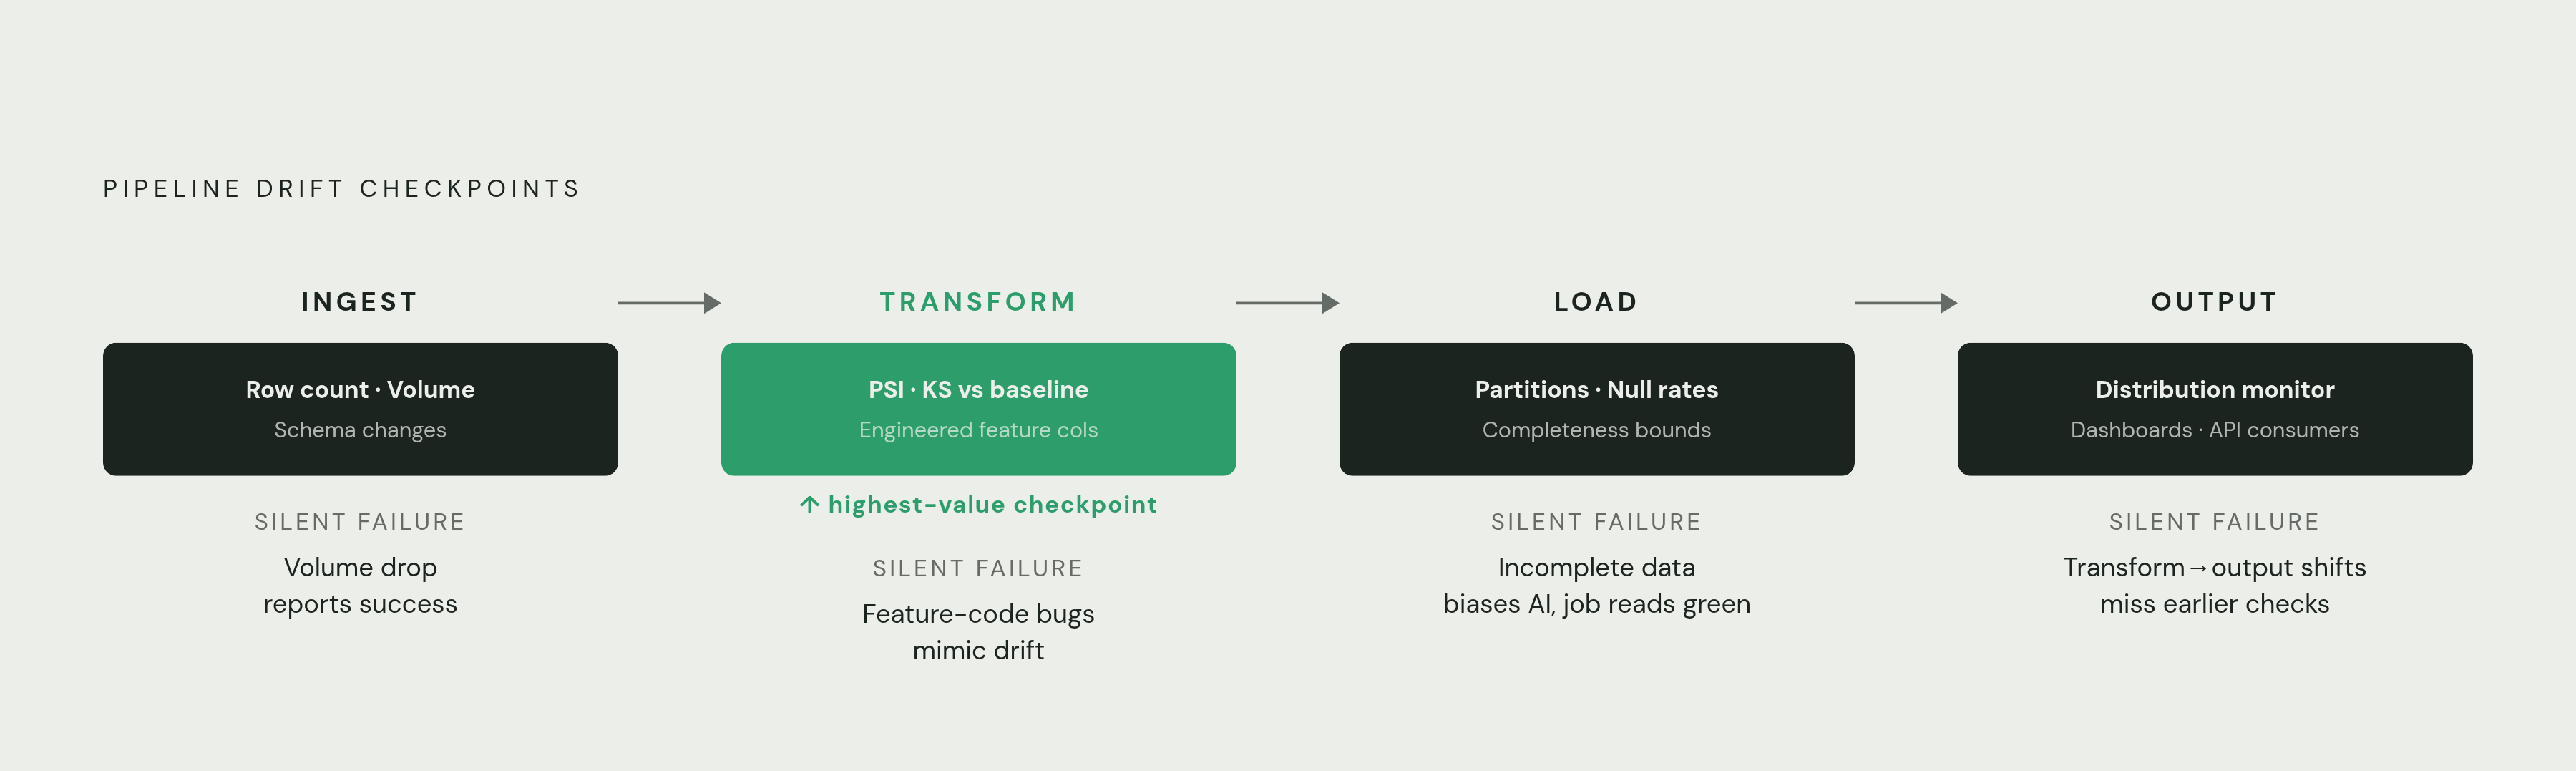
Catching inter-run shift requires checks at every stage of a pipeline's lifecycle, not just at its final output, because a shift that reaches a downstream model or dashboard has already passed through every consumer sitting between the source and that endpoint.
At ingest, the checks are blunt but effective: verify row counts and volume against historical patterns, and flag schema changes, new, dropped, or retyped columns, before transformation even begins. A volume drop that doesn't trigger a hard job failure is one of the most common silent failure modes in production pipelines, precisely because a pipeline that processes half its usual rows still reports success.
At the transform stage, run PSI or KS on engineered feature columns right after transformation, always against the fixed reference baseline described earlier, and if a feature crosses the moderate threshold, flag it for human review before it enters a feature store or a training dataset. This is the checkpoint closest to where feature-code bugs actually originate, which makes it the highest-value place to catch them before they propagate further.
At load, validate partition integrity, null rates, and completeness bounds before marking a batch ready for downstream consumption, since incomplete data fed into AI models produces biased or inaccurate outputs even when the job status itself reads green. And at output, monitor the distributions actually reaching dashboards and API consumers as a final check: if the statistical profile of what consumers receive differs from what the pipeline was expected to deliver, something broke somewhere between transform and output, and that's the signal that catches the failures the earlier checkpoints missed.
None of these checks should fire in isolation. The strongest version of this discipline alerts on a joint condition: input drift combined with a measurable drop in a downstream eval or business metric, not drift by itself. Drift without any downstream impact is a false alarm, and chasing false alarms burns on-call capacity while eroding trust in the entire monitoring system, a point the next section returns to directly. For AI and LLM pipelines specifically, drift monitoring works best wired into the same observability stream that already carries traces, evals, and protection gates, so a team ends up with one signal pipeline and one alert taxonomy instead of a second, disconnected monitoring system to maintain.
Setting the right threshold for shift detection
Treating every PSI exceedance as an action item degrades the very systems the monitoring was built to protect. You confirm a shift actually affects outcomes before you trigger a response that costs real time and real compute. More monitoring signals don't automatically mean better reliability, so before you retrain anything, you should confirm that a distribution change actually affects model accuracy or business metrics.
The asymmetry here matters. In traditional statistical process control, detecting an out-of-bounds signal triggers a cheap corrective action, tightening a machine, adjusting a setting. Modern ML models and enriched CRM records don't offer that same cheap correction: retraining a model or recleaning a CRM table is expensive and disruptive, and aggressive detection that triggers retraining on noise degrades calibration instead of improving it.
The calibration fix starts with scaling the threshold to the data, not holding it constant. PSI thresholds should be set relative to expected batch size, because at larger batch sizes, even genuinely tiny distributional differences will exceed a threshold calibrated for a smaller sample.
The second fix is the joint condition introduced in the previous section: use input drift plus a downstream metric drop as the actual trigger for automated action, and treat PSI alone as a warning-only signal that queues a human review rather than firing a remediation pipeline on its own. A third source of false positives is simple seasonality: a distribution shift in product-category columns during a major sales event is the expected behavior of the business, not an anomaly, and monitoring systems should accept known-event annotations that suppress alerts during these expected regime changes.
One further caveat belongs here, aimed at the commercial side of this conversation rather than the technical one. The case for automated CRM write-back sometimes leans on performance claims that can't be traced back to a primary source, and clean data may simply correlate with well-run sales teams rather than cause their performance directly. The honest framing is that data quality removes a constraint on performance, not that it guarantees a result.
Applying distribution shift detection to CRM and RevOps pipelines
CRM pipelines carry a structural decay dynamic, so if your organization uses CRM data to drive AI models or revenue decisions, you need inter-run shift detection. B2B contact data decays at roughly 25 to 30 percent per year, so a CRM that looks clean in January is measurably stale by the third quarter, and that decay appears as inter-run distribution shift in the enrichment, deduplication, and lifecycle-stage columns that RevOps teams rely on every day.
Tradeshift, a company in supply chain e-invoicing and accounts-payable automation, lived through a version of this at scale. Database duplicates made managing opt-outs nearly impossible, and both event lists and purchased lead lists lacked the data needed for proper segmenting and scoring, a combination that drove escalating costs from poor data quality long before anyone framed it as a distribution problem.
The lesson generalizes beyond Tradeshift's specific numbers. A RevOps pipeline that never checks its own distributions between runs cannot tell whether a CRM is quietly decaying on schedule or broken by a bad integration, until the quarter's pipeline numbers come in short and somebody has to explain why.