Null Rate Analysis Across Warehouse Tables
Continuous null rate monitoring catches pipeline breaks before downstream users do.
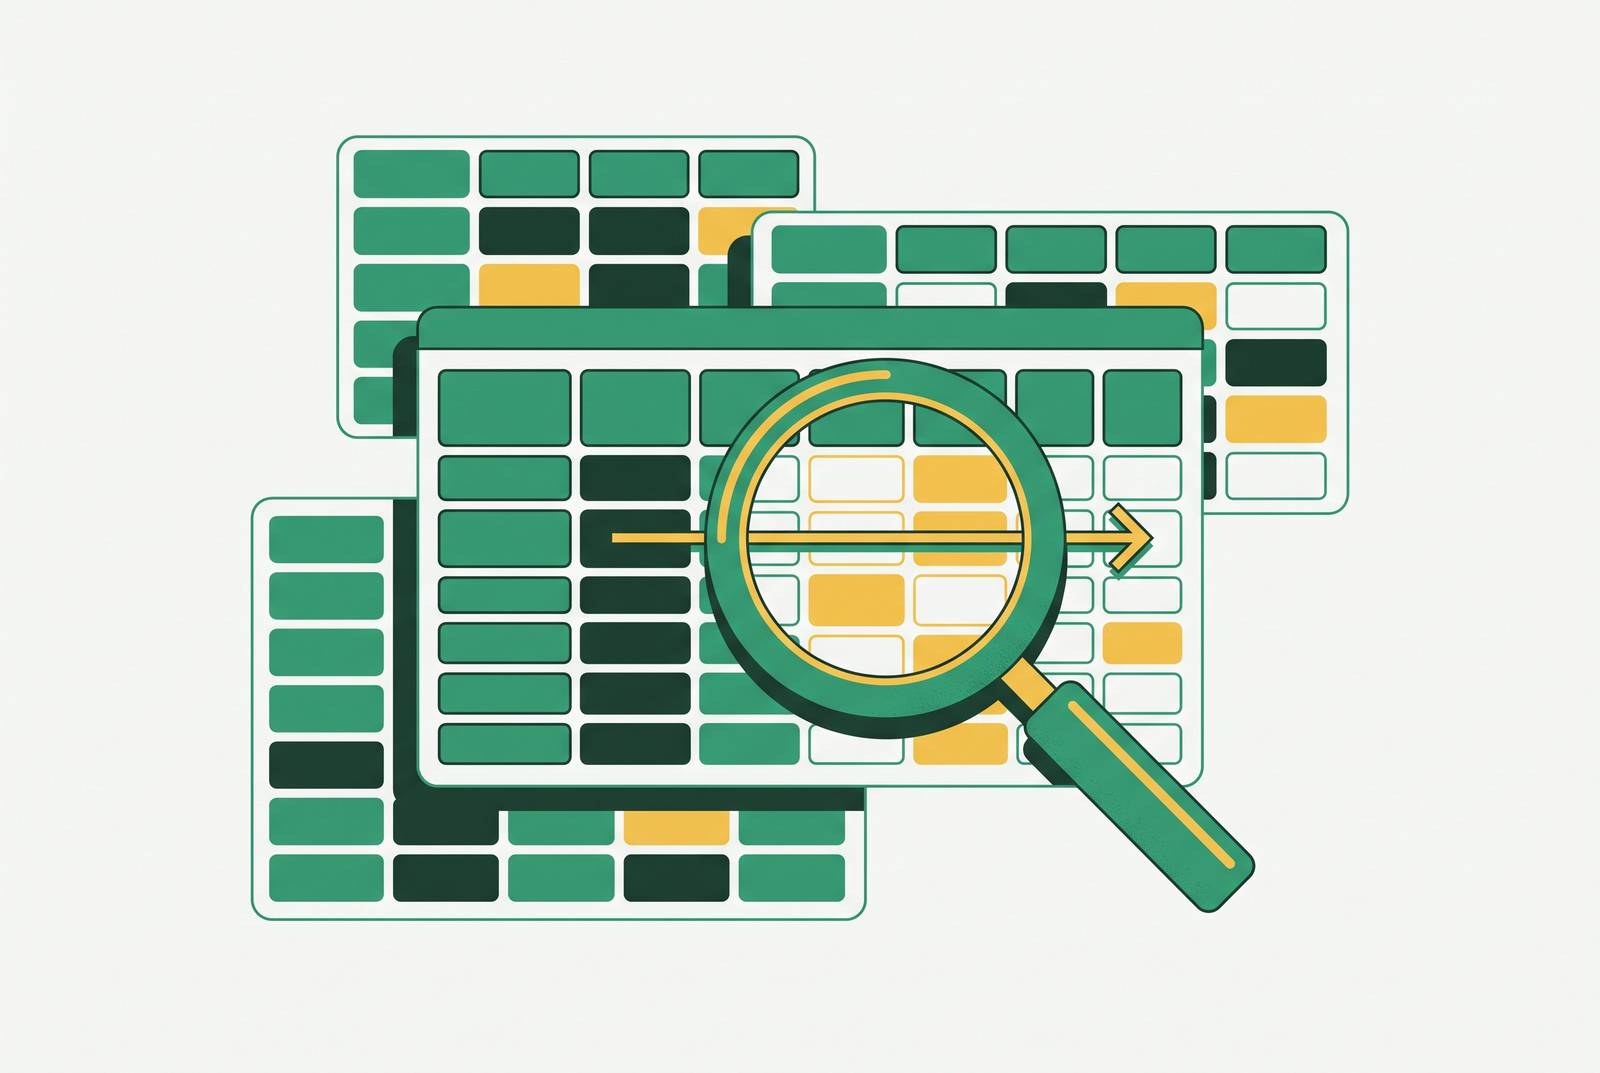
Null rate analysis measures how often values go missing across a warehouse table's fields, tracked by column, by table, and across time. Treated as a one-time cleanup task, it catches almost nothing worth catching. Treated as a continuous, dimensional metric, it becomes one of the earliest warning signs that something upstream has broken, before the corrupted data reaches a dashboard, a model, or a customer-facing report.
Null rates as a pipeline health signal, not just a data cleaning metric
The standard framing finds the nulls, decides whether to fill them or drop them, and moves on. That framing treats a null as a static defect to be cleaned rather than a symptom to be diagnosed. It misses the actual signal.
A null rate that holds steady at a low, consistent level for months and then jumps to a much larger share overnight is a pipeline that broke somewhere. It's a pipeline that broke somewhere, and the null rate is the first place the breakage became visible. Lineage, one of the five core dimensions of data observability alongside freshness, volume, schema, and distribution, is what makes that jump interpretable rather than just alarming. Without lineage, a spike in nulls is a mystery. With it, a spike in nulls is a pointer back to the specific extraction job, transformation step, or upstream source that changed.
The failure mode that makes this urgent isn't hypothetical. Downstream users, the analysts and product managers running reports, discover data problems roughly 70% of the time before the data engineering team has any idea something went wrong. That statistic alone should reorder how teams prioritize monitoring. A null rate check run once a week after the fact catches the failure only after someone downstream has already acted on bad numbers.
Null rate analysis: measures and limits
Null rate is the frequency of missing values in a field or record, expressed as a proportion of total rows over some window of time. That's the whole definition. The complexity comes in how it's applied.
Field-level completeness testing is one level, and record-level completeness is the other. Field-level completeness testing is the familiar kind: NOT NULL constraint checks, empty-string equality checks, the sort of thing most warehouse teams already run. Record-level completeness is less common and more revealing. It asks whether an entire row, taken together, actually represents something usable, because a record can be technically present, every field populated, and still be operationally incomplete if the combination of values doesn't hold together.
Here's the ceiling that null rate analysis runs into, and it gets glossed over often, so it needs to be stated: a field that is 98% complete can still be useless if the 98% that's populated is wrong. Null rate is a floor metric. It tells you what's absent, not what's inaccurate. A shipping address field with zero nulls and thousands of transposed zip codes will sail through a null rate check while quietly poisoning every downstream geographic analysis. Catching that requires a different class of test entirely: integrity tests, consistency tests, transformation validation. Null rate analysis is necessary. It was never meant to be sufficient on its own.
The three failure modes null rate spikes diagnose
A null rate spike is a symptom, not a diagnosis. But the underlying causes tend to sort into three recognizable categories, and knowing which one is in play changes what happens next.
Pipeline failure is the most direct. A source system stops sending a field, an extraction job fails silently instead of throwing an error, or a connector drops a column somewhere during load. Nothing crashes. Nothing pages anyone. The pipeline just quietly stops carrying a piece of information it used to carry.
Schema drift is subtler and widely recognized as a common cause of silent pipeline failures, precisely because static tests written against a prior schema have no way of seeing what changed. A column gets renamed upstream. A new field gets added and an old one deprecated. A type changes from integer to string and half the downstream logic starts failing comparisons without erroring out. Observability, watching the actual data as it flows, catches what a static test suite written six months ago has no way of seeing.
The third category is upstream data problems that have nothing to do with the pipeline's engineering. A vendor changes an API payload. A source team stops populating a field because a business process changed. Someone edits a CRM workflow rule and a field that used to auto-populate now sits blank for every new record created after the change. The warehouse just reflects the degradation faithfully, which is exactly the problem, because faithful reflection of bad upstream behavior looks identical to a dashboard as faithful reflection of good behavior. It just reflects the degradation faithfully, which is exactly the problem, because faithful reflection of bad upstream behavior looks identical to a dashboard as faithful reflection of good behavior, until someone checks.
Guidance circulating from data quality practitioners points toward making these metrics dimensional and normalizing them as rates over time, specifically so a team can trace a failure back to its actual stage: was it schema drift, was it an upstream source change, was it something else. That tracing only works if checks run against source data directly, not just after it lands in the warehouse. By the time a warehouse table reflects a problem, whoever consumes that table downstream may already be building on top of it.
That's the silent propagation problem in a sentence: poor data quality rarely announces itself at the point of failure. It shows up later as lost revenue, operational inefficiency, and corrupted model outputs, and the root cause is buried under everything built on top of it since, making it hard to trace back.
Building null rate monitoring as a continuous, dimensional metric
The architectural decision that separates a useful null rate program from a decorative one is to treat the null rate as a time series, not a validation rule. A validation rule returns pass or fail. A time series shows you the shape of the change. The actual diagnostic value lives in that shape.
That means storing the computed rate, not just checking it against a threshold and discarding the result. From there, four dimensions matter. Field-level null rate shows which specific columns are degrading. Table-level null rate gives an aggregate completeness posture, useful for a birds-eye view but too coarse to catch a problem localized to one column. Time-windowed rate shows how a given field's null rate has moved across days, weeks, or load cycles, which is what actually reveals a spike versus normal noise. And partition or segment slicing affects whether a null rate problem localized to one region, one account tier, or one date partition can hide completely inside a healthy-looking aggregate number.
None of this requires exotic tooling to start. Major cloud warehouse and lakehouse platforms support the aggregations needed to compute and store these metrics natively. The barrier to starting a null rate monitoring program is discipline about where and how often the checks run. It's discipline about where and how often the checks run.
Checks should be built into three stages. Source validation, before data ever enters the pipeline, catches problems at the earliest possible point. Transformation validation, mid-pipeline after business logic has been applied, catches problems introduced by the logic itself. Post-load validation, once data has landed in the warehouse's target layer, catches everything that slipped through the first two and confirms what actually reached the tables people query against.
The cost of unchecked null rates in downstream systems
The propagation dynamic described earlier isn't abstract. Poor data quality that goes unmonitored raises lost revenue, operational inefficiency, compliance exposure, and missed opportunities downstream, and these effects tend to appear long after the moment it actually started.
The dollar figures back this up. Poor data quality costs organizations an average of $12.9 million, and 43% of chief operations officers name data quality issues as their single most significant data priority. Over a quarter of organizations estimate annual losses above $5 million from the problem, and 7% report losses of $25 million or more. Research from MIT Sloan Management Review, conducted with Cork University Business School, found companies lose between 15% and 25% of annual revenue to poor data quality. That's a material fraction of the business.
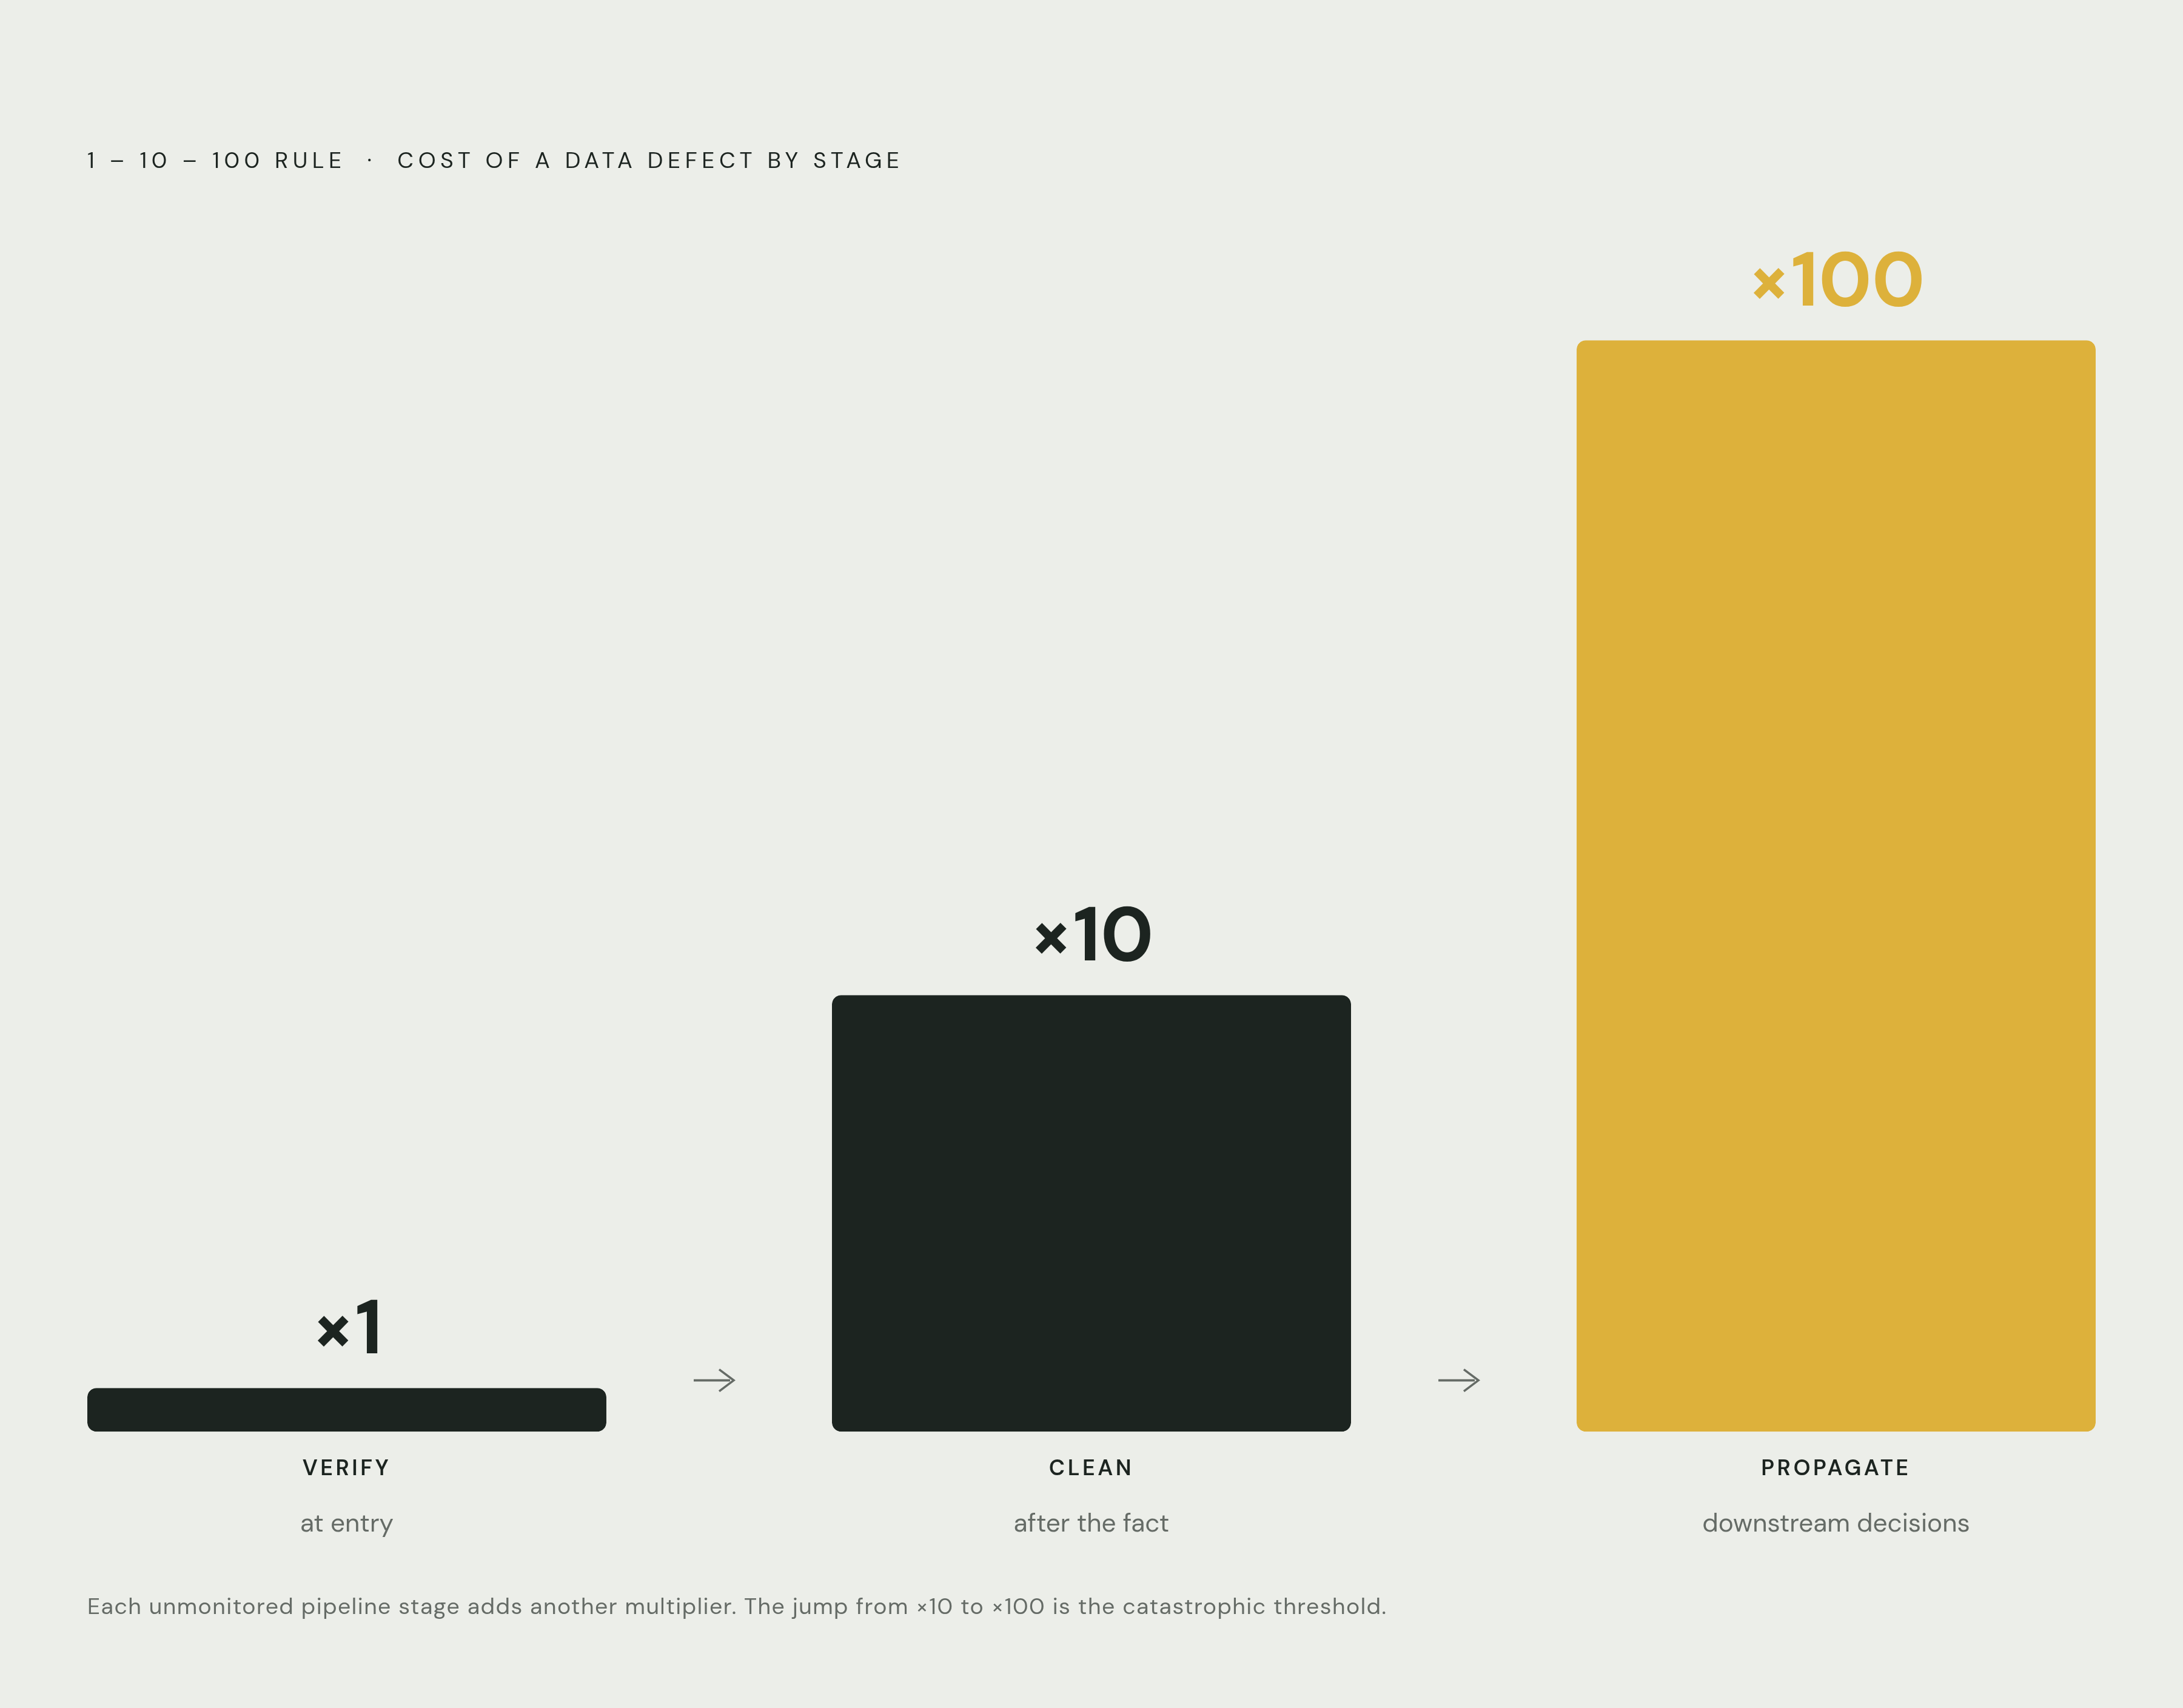
The 1-10-100 rule frames why waiting is expensive: the cost of correcting a data problem grows substantially at each stage it is allowed to pass through, from verification at entry, to cleaning after the fact, to the far larger cost of leaving it to propagate through downstream decisions and systems. A null rate left unmonitored doesn't sit still on that curve, it compounds along it, and every additional pipeline stage the bad data passes through adds another multiplier.
There's a human cost behind the dollar figures too. Employees spend up to 27% of their time correcting bad data rather than doing the analysis or decision-making the data was collected for. That's more than a quarter of a workweek spent fixing what monitoring should have caught before anyone had to touch it manually.
Null rate problems as AI problems at enterprise scale
Null rates become more consequential as organizations push more of their pipeline output into machine learning systems. The mechanism is straightforward: missing values in input fields produce incomplete or biased training data, and the compounding effect is severe. Even a 5% error rate in training data can produce a 15% to 20% degradation in model performance. That's not a linear relationship. A small quality problem at the input produces an outsized quality problem at the output.
Garbage in, garbage out is an old principle, but it behaves differently in an automated, algorithmic environment than it did in a spreadsheet someone reviewed by eye. A pipeline doesn't pause to sanity-check what it's fed. It amplifies whatever incompleteness is already sitting in the data, at whatever scale it's operating.
The stakes are rising because the spending is rising. AI investment is forecast to surpass $2 trillion in 2026, growing 37% year over year. Every dollar poured into that buildout sits on top of a data foundation, and if that foundation has an unmonitored null rate problem, the cost of the problem scales right alongside the investment.
The clearest evidence that this isn't theoretical: 42% of companies scrapped most of their AI initiatives in 2025, compared with 17% the year before. Poor data quality and the lack of underlying information architecture are cited as the drivers behind those scrapped initiatives, and that pattern produces the dynamic seen here. Data completeness problems are rarely the only issue in such failures, but they are often among the earliest measurable signals that something is wrong.
The tooling landscape for continuous null rate monitoring at scale
Scale breaks manual approaches first. Most enterprises are managing data assets numbering in the tens or hundreds of thousands, spread across cloud warehouses, lakehouses, dbt models, semantic layers, and operational systems bolted on over the years. Manual rule authoring, someone writing a NOT NULL check by hand for each table that matters, cannot cover that surface area. Programs built this way tend to land in the same place: deep, careful coverage on a few hundred tables someone cared enough to instrument, and effectively no coverage anywhere else.
Three tiers of tooling address this at different depths. Native warehouse features, like the data quality and data metric functions built into platforms such as Snowflake, offer a solid baseline and integrate directly into existing pipelines, though they tend to be limited when it comes to cross-system trend analysis spanning multiple platforms.
SQL-native, developer-first tools sit a level up, built around writing quality checks as code and running them as part of the pipeline itself, with governance depth that scales from light to moderate depending on how the checks are organized and maintained.
ML-driven observability platforms and governance-first catalog platforms form the third tier, covering everything from anomaly detection tuned for data engineers operating at scale, to unified catalog and stewardship platforms built for chief data officers who need policy-driven quality rules enforced across a regulated environment, to lineage-integrated monitoring meant to give context to an anomaly rather than just flagging it. Different organizations land in different corners of this tier depending on whether the primary buyer is an engineering team or a governance function, and depending on how regulated the industry is.
Autonomous, no-code approaches built specifically for cloud warehouse data represent a further development in this space, with recent industry recognition including recognition in the Forrester Wave for AI-driven data quality, and expansion in 2025 and 2026 toward intelligent analyst features and workflow tooling aimed at unstructured data. Separately, autonomous DataOps approaches have drawn recognition too, including a 2025 Gartner Cool Vendor designation in data management, worth a look for teams specifically evaluating that category.
Moving from alerting to autonomous remediation for null rate issues
Getting an alert that a null rate spiked is not the same thing as fixing whatever caused it. That gap is where a lot of monitoring programs quietly stall out: the alert fires, someone on the data team opens a ticket, and then manual triage, root cause investigation, and a remediation queue stand between the alert and an actual fix. The alert did its job. Everything after it is still manual.
The agentic shift underway in DataOps is aimed squarely at that gap. It points toward systems capable of taking independent action based on what they observe in real time, rather than just surfacing an observation and waiting for a human to act on it. That includes autonomous anomaly detection, automatic tracing of root cause back to the specific upstream source, and self-healing pipelines that recommend, and in some cases execute, fixes without someone approving each step manually.
Self-healing in this context means something more than a static threshold tripping an alarm. It involves models trained to learn what normal looks like for a given field or table, so they can flag a deviation a human reviewing a dashboard once a week would likely miss. The system acts on what it finds rather than simply reporting it and waiting.
Modern observability platforms have started automating root cause analysis by using lineage graphs to correlate related anomalies across an entire dependency chain, tracing a scatter of downstream failures back to the single upstream event that caused all of them. Done well, that turns an investigation that used to take hours of manual tracing into something resolved in minutes. Null rate monitoring, built this way, stops being a report someone reads after the damage is done. It becomes part of the system that catches the damage before it spreads.