How to Profile an Unfamiliar Data Warehouse Before Integration
Discover hidden defects in structure, content, and relationships before merging data.

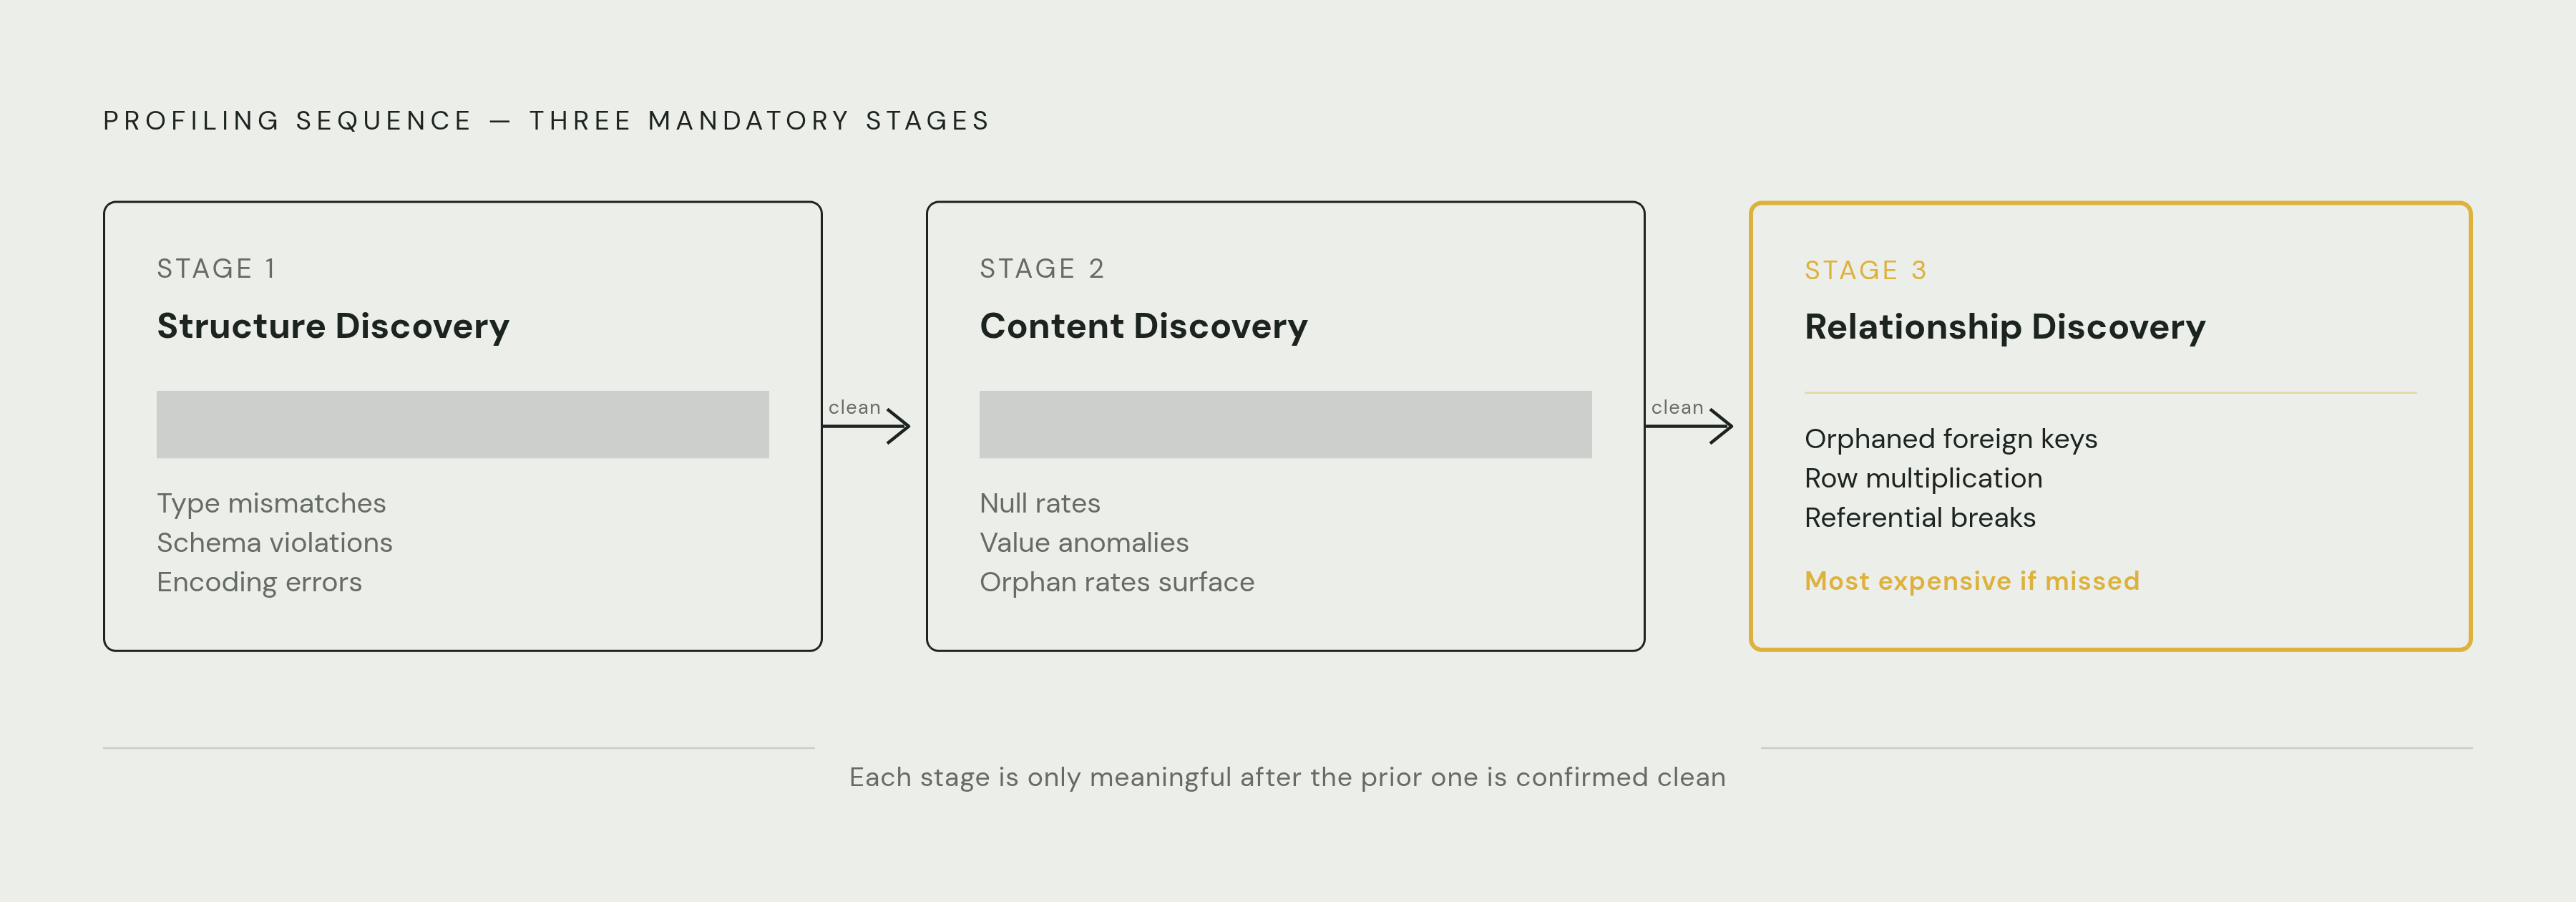
Profiling an unfamiliar data warehouse before integration means checking its structure, content, and relationships in that order. Each stage exposes defects the previous stage cannot detect. For CRM data quality in M&A integration, this sequence establishes whether customer identifiers, field values, and cross-table links are fit to merge, rather than treating a clean-looking column profile as proof of readiness.
Why profiling an unfamiliar warehouse before integration is a sequenced investigation, not a checklist
Skipping straight to summary statistics produces false confidence. A column can appear suitable for integration while its declared type misrepresents its contents or its values point to records that no longer exist. Structure problems corrupt content statistics, and content anomalies can mask broken relationships. The investigation therefore has to establish what the warehouse contains before assessing its values, then establish whether those values connect as expected.
Profiling is read-only analysis of the data’s current shape. It does not establish which values are true. A profile can show sixty distinct values where five were expected, but it cannot determine which value is correct. Decube’s profiling guide distinguishes this measurement from monitoring, which raises an incident when the data changes. That distinction keeps the initial investigation focused on evidence rather than treating a snapshot as an ongoing guarantee.
Panoply’s profiling guide groups the investigation into structure discovery, content discovery, and relationship discovery. Labels such as metadata discovery, single-field profiling, and cross-field profiling describe subdivisions. The source is the proper starting point. To preserve evidence of upstream defects, the analyst should profile the source system rather than an already-transformed copy, because transformations can hide the problems that integration due diligence needs to expose.
Structure discovery: reading the warehouse's skeleton before touching its data
A misread schema makes subsequent statistics unreliable. Structure discovery establishes each column’s data type and whether that declaration matches the values in storage. A column declared as a string but containing consistently numeric values presents a type mismatch that can silently break aggregations. Before relying on content statistics, the analyst needs to know whether the schema describes the data as it is or as it was once meant to be.
Field lengths and format distributions show how well that description fits the stored data. When the maximum observed string length matches the declared column width, it is usually a sign of silent truncation upstream. Two dominant formats in a date column show that dates were handled in different ways upstream, while email-pattern distributions show how often values fit the expected shape. A value can fit its allotted width and pattern without being the value the integration needs.
Metadata accuracy extends the same examination to table definitions and column descriptions. A supposed category column with a high cardinality ratio can reveal free-text entry where an enumeration was intended. Schema drift introduces a different discrepancy, including fields added, removed, or renamed since the last documented source version. Documentation alone is therefore not sufficient evidence. Once the schema has been confirmed against the source, the analyst knows which columns are understood well enough to support meaningful content statistics.
Content discovery: what the rows actually contain, column by column
Content discovery moves from the declared container to the values inside it. The eight measures for a thorough column profile come from Decube’s column-statistics breakdown and Panoply’s guide. Each measure catches a failure mode that the others can miss. Computing the set consistently prevents a reassuring result on one measure from concealing a defect visible through another. A plausible range, for example, says nothing about whether a mandatory field is populated.
Null rate measures the share of missing values. A jump from a low rate to a high rate in a mandatory column is a failure requiring investigation. Distinct count counts how many different values there are, while unique count counts how many appear exactly once. Their divergence exposes repetition that becomes consequential when the column is used in a join.
Cardinality ratio compares the distinct count with the row count. A customer identifier with a ratio well below 1.0 is not identifying one entity per row. Duplicate rate on business keys sharpens that finding by measuring repetition where the business expects exactly one entity. Cardinality shows the column’s overall shape, while business-key duplication checks an assumption that a join or aggregation may rely on.
Min and max establish range boundaries, bringing negative quantities, dates of birth in 1900 or 2087, and sentinel values such as 9999-12-31 into view. Pattern and format distribution measures how much of the column follows an expected form, while length distribution measures the spread of string lengths. The structural pass supplies the context for interpreting both. Together, these measures can reveal problems that recur upstream, such as phone numbers without area codes or placeholder values passed off as real data.
Referential overlap, also called orphan rate, is the last measure in the set and counts foreign-key values that have no match in the parent table. It belongs in the profile, but interpreting it requires relationship discovery. Even a complete account of missingness, repetition, ranges, formats, and lengths cannot show whether an otherwise plausible value refers to a valid record elsewhere.
Relationship discovery: finding the defects that structure and content cannot see
Most cloud warehouses do not enforce foreign-key constraints at write time. Orphaned records can therefore accumulate without a constraint failure, remaining unnoticed until a downstream join or aggregation exposes them. Relationship discovery tests the connections that the first two stages cannot establish. A team that stops after column-level content profiling has left the most expensive integration defects undiscovered, even if every examined column looks orderly in isolation.
Panoply’s guide describes relationship discovery as understanding how data is interrelated so that sources can be united or imported without losing important relationships. Key identification begins that work by finding candidate primary keys and establishing that they are unique and non-null before treating them as join anchors. Foreign-key validation then checks whether values in the child table are also in the parent. The orphan rate becomes actionable at this stage. Its significance depends on the relationship the integration expects to preserve.
Functional dependencies reveal whether one attribute reliably determines another across the table. They can reveal business rules that are missing from the schema documentation. Inclusion dependencies test a related but different condition, namely whether a value set in one table is a legitimate subset of values in a reference table. These tests reach beyond individual column quality. They check whether the links that seem to exist in the warehouse hold across records and tables.
A foreign-key column can have few missing values and a sensible format while referring to parent rows that no longer exist. A documented one-to-one relationship can instead produce row multiplication because rows match multiple records across tables. Circular references and hidden lookup hierarchies can cause infinite loops in lineage or transformation logic. None of these defects requires malformed individual values. In a CRM merger, that distinction prevents clean-looking customer records from being mistaken for evidence that the planned joins are sound.
How sampling strategy and scan scope affect what each profiling layer finds
A profile’s precision depends on what it actually examined. An undisclosed sample can produce a figure that looks exact yet differs by an order of magnitude from the full-table result. Panoply’s guide notes that some widely used profilers inspect only the first rows by default unless configured otherwise. The same guide says that PostgreSQL’s default statistics target for each column is limited. A supplied profile may therefore describe a small, unrepresentative fraction of the source.
The practical rule is to record scan scope before quoting a statistic. Columns containing money, identity, or dates require full scans because misleading null or duplicate rates on those columns create disproportionate integration risk. Other columns can be sampled for initial discovery. In large environments, a random sample supports the first structural and content pass, with full scans reserved for critical columns and those flagged as high-risk.
Relationship discovery needs full scans of the join keys. A sampled orphan rate can look acceptable when the full-table rate is not, so the sample cannot establish that a planned relationship is safe. Each reported statistic should disclose whether it came from a sample or a full scan and how much data it covered. Scope is part of the measurement itself. A null rate without a denominator does not provide a trustworthy basis for an integration decision.
Assessing CRM data quality for M&A integration before records move
A profile supplies evidence. The readiness assessment uses that evidence to decide which findings are blockers, which need transformation tasks, and which are acceptable before records cross the integration boundary. Teams merging customer data after an acquisition need to look into duplicate business keys before they trust joins or aggregations. The profile measures repetition as a defect, while a justified resolution requires establishing which customer value is correct.
Structural anomalies affecting keys or join columns are blockers because a type mismatch can corrupt downstream joins. High null rates are blockers when the affected fields are required by the target schema or downstream models. Orphaned foreign keys block integration when the relationship supports reports or AI models that will consume the data. Not every defect requires a stop. Format inconsistencies and sentinel values can be transformation tasks, provided they are documented before ETL rules are written.
Peliqan’s data quality best-practices guide identifies source validation as the point where defects are cheapest to catch. Defects become more expensive to fix in the transformation layer and most expensive in production. This makes classification a practical decision about timing. A known format inconsistency can inform a transformation rule, whereas an unresolved key mismatch undermines the relationship that transformation would rely on. Calling both findings simply “data quality issues” conceals that work on the format inconsistency can proceed while work on the unresolved key mismatch must wait.
The assessment should preserve enough detail to justify those decisions. For each column, it should record the statistic, measured value, expected range, scan scope, and defect classification. For each table, it should record orphan rates on candidate foreign keys and the risk of row multiplication in planned joins. The overall assessment should name unresolved blockers, required transformation rules, and relationship assumptions. Versioning and retaining that evidence also gives post-integration monitoring a baseline against which to detect drift.
Why the profile baseline matters after integration, not just before it
The source warehouse continues to change after integration begins. Panoply’s guide describes a profile as a snapshot that decays as new data arrives and recommends recurring profiling runs. A retained baseline makes those later measurements comparable to the conditions under which integration was approved. Without that reference, a new profile describes the present but does not establish what moved. Monitoring can use the difference to identify departures that warrant an incident.
Schema drift is the most common post-integration defect. When fields are added, removed, or renamed upstream, they can break transformation logic and downstream outputs without anyone noticing. A versioned profile makes these changes visible when they occur. Rising duplicate rates, shifting null rates, and growing orphan rates can reveal deterioration even when table definitions remain familiar.
AI and revenue-system use cases raise the stakes. A model trained on clean integrated data can degrade as the source drifts, with no human noticing until its outputs are wrong. Agentic systems that continuously monitor, detect, and propose or apply fixes address the gap between a one-time investigation and sustained reliability. The pre-integration profile gives that continuing work a defined reference, preserving the evidence needed to distinguish acceptable change from the loss of assumptions on which integration depends.